Learning how to read WordPress error logs is the difference between guessing and doing real technical troubleshooting. When a WordPress site breaks, the logs reveal the real cause behind white screens, 500 errors, broken checkouts, or login loops.
This guide shows you how to find, enable, and interpret WordPress and server logs so you can identify the real cause of errors. Instead of randomly disabling plugins or changing settings, you will follow a structured, technician-level approach to diagnostics.
1. Why WordPress Error Logs Matter
Most common WordPress problems come from PHP errors, plugin conflicts, database issues, and server misconfigurations. A proper WordPress troubleshooting workflow always starts from the logs, not from trial and error.
By reading error logs, you can:
- Identify which plugin, theme, or file is causing the issue
- See the exact line and function where the error occurs
- Understand whether the problem is in WordPress, PHP, the database, or the server
- Reduce downtime and avoid making random changes that break more things
A structured approach to WordPress error log analysis always begins with understanding what the logs are trying to tell you. For deeper debugging concepts, see the official WordPress debugging documentation.
2. Where WordPress Error Logs Are Located
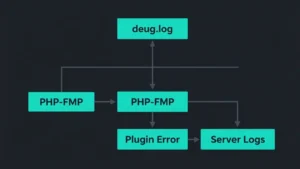
Depending on your setup, logs can live in different places. The most common locations are:
- WordPress debug log: wp-content/debug.log
- PHP error log: often in /var/log/php* or defined in php.ini
- PHP-FPM log: for pools and process manager issues
- Nginx error log: usually /var/log/nginx/error.log
- Apache error log: usually /var/log/apache2/error.log or similar
- MariaDB/MySQL logs: general log and slow query log
On managed panels (CloudPanel, cPanel, Plesk, etc.), you often have a dedicated “Logs” section where you can view error logs per vhost or per site.
If the issue is related to slow loading times or high resource usage, you should also read the WordPress Performance Optimization: Complete Technical Guide to understand how PHP, database, and caching affect what you see in the logs.
3. How to Enable WordPress Debug Mode
By default, WordPress does not log errors to a file. To enable logging, you need to edit wp-config.php and add or adjust the following lines:
define('WP_DEBUG', true);
define('WP_DEBUG_LOG', true);
define('WP_DEBUG_DISPLAY', false);
This configuration does three important things:
- WP_DEBUG: turns on debugging mode
- WP_DEBUG_LOG: writes errors to wp-content/debug.log
- WP_DEBUG_DISPLAY: hides errors from the front-end (safer for production)
Once enabled, WordPress will start logging PHP errors, warnings, and notices into debug.log. For deeper PHP-level details, the PHP error handling documentation is the best reference to understand functions, parameters, and deprecations.
4. How to Read WordPress Error Logs
At first glance, a log file can look intimidating. However, each line follows a pattern. A typical entry might look like this:
[20-Mar-2026 10:15:32 UTC] PHP Fatal error: Uncaught Error: Call to undefined function my_plugin_function() in /var/www/html/wp-content/plugins/my-plugin/includes/class-core.php on line 123
From this single line, you can extract a lot of information:
- Timestamp: when the error occurred
- Error type: PHP Fatal error
- Message: what went wrong (e.g. undefined function)
- File path: which file is involved
- Line number: where in the file the error occurred
- Component: plugin, theme, or core file
In this example, you immediately see that the issue comes from a plugin file: wp-content/plugins/my-plugin/…. That means the problem is not in WordPress core, but in that specific plugin. A proper WordPress repair process always starts by identifying the exact file and line, instead of randomly disabling everything.
5. Understanding the Most Common Error Types
When reading logs, you will see different error levels. The most common ones are:
- Fatal error: stops execution completely; usually breaks the site
- Warning: something is wrong, but execution continues
- Notice: minor issue, often related to undefined variables or array indexes
- Deprecated: a function or feature will be removed in future versions
- Uncaught exception: an exception that was not handled properly
Fatal errors and uncaught exceptions are usually the ones that cause white screens and 500 errors. Warnings and notices are still important, especially on development or staging environments, because they often reveal bad coding practices or future problems.
Understanding these error types is essential for applying technical WordPress fixes that are stable and not just quick hacks.
6. How to Identify the Plugin or Theme Causing the Error
Most real-world WordPress issues are caused by plugins or themes, not by WordPress core. When performing WordPress error log analysis, the log file usually tells you exactly where the problem is—if you know what to look for.
Look for:
- File paths: wp-content/plugins/… or wp-content/themes/…
- Function names: often include the plugin or theme prefix
- Repeated patterns: the same file or function appearing in multiple errors
Once you identify the plugin or theme involved, you can:
- Disable it temporarily
- Update it to the latest version
- Check its documentation or changelog
- Contact the developer if the error is clearly on their side
Many common WordPress problems come from outdated or poorly coded extensions. The log is your map to find them.
7. How to Read Server-Level Logs
Sometimes the issue is not inside WordPress itself, but at the server level. In those cases, WordPress logs may not show enough information, and you need to look at:
- PHP-FPM logs: for process manager issues, timeouts, and crashes
- Nginx or Apache error logs: for 502, 504, and other gateway errors
- MariaDB/MySQL logs: for connection problems and slow queries
For example, if you see frequent 504 Gateway Timeout errors, the Nginx or Apache error log will often show whether PHP-FPM is timing out or crashing. If the logs show slow queries or locked tables, the MariaDB Knowledge Base is an excellent resource to understand what is happening at the database level.
If your logs reveal slow queries or heavy database load, the WordPress Performance Optimization: Complete Technical Guide will help you reduce the impact on performance and stability.
8. Real-World Examples from WordPress Error Logs
Here are some common errors you will see in WordPress logs and what they usually mean.
Allowed memory size exhausted
This means PHP ran out of memory. It often happens with heavy plugins, large imports, or poorly optimized queries.
Maximum execution time exceeded
A script took too long to run. This can be caused by slow external requests, large database operations, or inefficient loops.
Call to undefined function
WordPress is trying to call a function that does not exist. This usually points to a missing file, a plugin not loaded correctly, or a compatibility issue.
Headers already sent
Output was sent before headers, often due to extra spaces, BOM, or echo statements in the wrong place.
Too many connections / MySQL server has gone away
The database is overloaded or misconfigured. This is common on busy sites or under heavy traffic.
Each of these errors can be the starting point for a dedicated article or a deeper troubleshooting session. The important part is that the log gives you a clear direction.
9. When You Should Not Fix It Yourself
Reading logs is a powerful skill, but not every issue should be handled manually, especially on production sites. You should consider involving a specialist when:
- The site is an active e-commerce or mission-critical application
- The error involves database corruption or data loss
- The logs show repeated crashes at the server level
- You see signs of malware, backdoors, or suspicious code
In those cases, a wrong move can make things worse. Understanding the logs still helps you communicate clearly with whoever will handle the fix, but the actual intervention should be done with experience and a proper backup strategy.
FAQ: WordPress Error Logs
Why do WordPress errors happen so often?
WordPress errors are common because the platform relies on multiple layers working together: PHP, themes, plugins, the database, and the server. When one of these layers becomes outdated, misconfigured, or overloaded, errors appear.
What is the fastest way to diagnose a WordPress error?
The fastest method is enabling WP_DEBUG and checking debug.log and PHP error logs. For server-level problems, checking PHP-FPM logs and Nginx or Apache error logs is essential.
How do I find the plugin causing a WordPress error?
Look at the file path and function names in the log entry. If you see wp-content/plugins/plugin-name/…, the issue is inside that plugin.
Can server issues cause WordPress errors?
Yes. PHP-FPM saturation, high CPU usage, disk I/O bottlenecks, and insufficient RAM can all trigger WordPress errors.
Should I keep WP_DEBUG enabled on production?
You should not display errors on production, but logging them is extremely useful. Enable WP_DEBUG and WP_DEBUG_LOG, but keep WP_DEBUG_DISPLAY set to false.
Conclusion
Learning how to read WordPress error logs transforms the way you approach problems. Instead of guessing, you work with real data. Instead of disabling everything blindly, you identify the exact file, function, and component responsible for the issue.
Whether you manage a small blog or a high-traffic WooCommerce store, mastering log analysis is the foundation of reliable troubleshooting. It saves time, reduces downtime, and gives you full control over what is really happening behind the scenes.
To learn more about my diagnostic workflow, visit the About Vincenzo — WordPress & Server Specialist page.